View Our New Interactive Map
Use our new interactive map of demolitions and displacements since January 2020:
Maps Illustrating Demolitions and Displacements by Month
Click on the link to view any map. The maps may also be viewed in PDF format on the relevant monthly Demolition and Displacement Report.
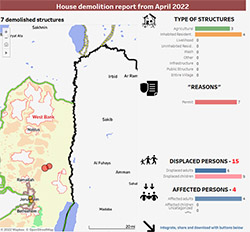
May 2023
Map showing demolitions during May 2023
April 2023
Map showing demolitions during April 2023
View map as PDF within April 2023 Demolition and Displacement Report
March 2023
Map showing demolitions during March 2023
View map as PDF within March 2023 Demolition and Displacement Report
February 2023
Map showing demolitions during February 2023
View mao as PDF within February 2023 Demolition and Displacement Report
January 2023
Map showing demolitions during January 2023
View map as PDF within January 2023 Demolition and Displacement Report
December 2022
Map showing demolitions during December 2022
View map as PDF within December 2022 Demolition and Displacement Report
November 2022
Map showing demolitions during November 2022
View map as PDF within November 2022 Demolition and Displacement Report
October 2022
Map showing demolitions during October 2022
View mao as ODF within October 2022 Demolition and Displacement Report
September 2022
Map showing demolitions during September 2022
View map as PDF within September 2022 Demolition and Displacement Report
August 2022
Map showing demolitions during August 2022
View map as PDF within August 2022 Demolition and Dispacement Report
July 2022
Map showing demolitions during July 2022
View map as PDF within July 2022 Demolition and Displacement Report
June 2022
Map showing demolitions during June 2022
View map as PDF within June 2022 Demolition and Displacement Report
May 2022
Map showing demolitions during May 2022
View map as PDF within May 2022 Demolition and Displacement Report
April 2022
Map showing demolitions during April 2022
View map as PDF within April 2022 Demolition and Displacement Report
March 2022
Map showing demolitions during March 2022
View map as PDF within March 2022 Demolition and Displacement Report
February 2022
Map showing demolitions during February 2022
View map as PDF within February 2022 Demolition and Displacement Report
January 2022
Map showing demolitions throughout Israel and the OPT during January 2022
Map showing demolitions in East Jerusalem during January 2022
View maps as PDFs within January 2022 Demolition and Displacement Report
December 2021
Map showing demolitions during December 2021
View map as PDF within December 2021 Demolition and Displacement Report
November 2021
Map showing demolitions during November 2021
View map as PDF within November 2021 Demolition and Displacement Report
October 2021
Map showing demolitions during October 2021
View map as PDF within October 2021 Demolition and Displacement Report
September 2021
Map showing demolitions during September 2021
View map as PDF within September 2021 Demolition and Displacement Report
August 2021
Map showing demolitions during August 2021
Map showing the number of people displaced by demolitions during August 2021
Mao showing the numbers otherwsie affected by demolitions during August 2021
View maps as PDFs within August 2021 Demolition and Displacement Report
July 2021
Map showing demolitions during July 2021
View map as PDF within July 2021 Demolition and Displacement Report
Animated maps illustrating demolitions over time
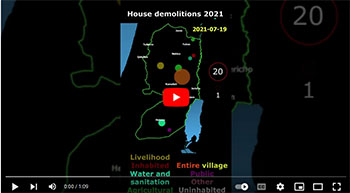
Animation Showing Demolitions in West Bank and Naqab Desert During 2021
ICAHD video documenting each demolition in the West Bank or the Naqab during 2021.
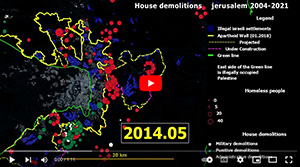
Animation showing demolitions in Jerusalem from 2004 to 2021
ICAHD video illustrating demolitions in the Jerusalem area between 2004 and 2021.